
To display objects on the map and the possibility of interactive interaction with them, it is necessary, firstly, to have the base map itself, which is used for the main rendering of various layers – countries, cities, water, etc., and secondly, an SDK for working with your data, which the system loads, processes and transfers control to the user upon an interactive request.
Within the SDK, it is important to understand the quantity and quality of features (from the English Feature – property, attribute, parameter) that are available to the user. In this case, features mean some objects that have geographic boundaries, certain properties and attributes. [3]
Large commercial systems
The most famous and prominent players in the market of interactive data visualization systems are Yandex, Google and MapBox. The first one has Yandex Map API, Google respectively has Google Maps API and Mapbox has a MapBox API solution.
The main advantages of commercial systems are their stability, availability, a large number of features and options for interacting with maps at the API level. Also, in such projects, documentation is usually well developed, which is a very important stage at the time the developer gets to know the new system.
The main disadvantage of such systems is their cost. Usually they have certain quotas for free use, which are often enough to launch an MVP project, but if the development goes beyond the MVP, then you have to pay for additional quotas for using these API services. [5, 6, 9]
Despite the fact that the presented commercial projects have good documentation and versatility, they can still be limited in certain areas, because the developer does not have access to the code of these systems and, accordingly, he will not be able to go beyond the original functionality conceived by the creators of these systems.
Free open source SDKs
Fortunately for developers for interactive work with maps, there are free and open source solutions, due to which it is possible to tune and implement any functionality for which there is enough technical knowledge and courage to implement. These systems include OpenLayers and Leaflet.
The problem with such SDKs is that you need a separate card to work with them. these SDKs do not have their own data. For these needs, they usually use an open and free map – OpenStreetMap. A similar situation is with additional data that will need to be associated with the map. In other words, setting up such SDKs becomes more difficult already at the data stage, and not just the difficulty of parsing the source code of the project.
Also, the obvious disadvantages of such projects include documentation – it is usually not developed as well, accessible and understandable as it is done for commercial products, many things need to be understood and read directly from the source code of the project, which also greatly slows down the development process.
Speaking about OpenStreetMap, it is worth noting that this map is transmitted as pictures and there is no access to modifying its style. And to update the map and data, you will need to download and update it regularly. [1]
When working with OpenLayers, there are both great opportunities, on the one hand, and great difficulties, on the other hand – code performance is something that the developer will have to monitor on their own, because. this will affect the rendering speed of the map. [2]
An interesting advantage of Leaflet is that the SDK has its own API, but this API is very limited and requires serious work to extend the functionality to the needs of the developer. This system has a pool of various plugins, which in general can facilitate development. In general, the project is suitable for medium development complexity, while complex projects on this SDK can be difficult to do. [8]
Vector and raster layers
For display on the map, layers are used – vector and raster (see Fig. 1). A layer is a collection of data with relevant styles.
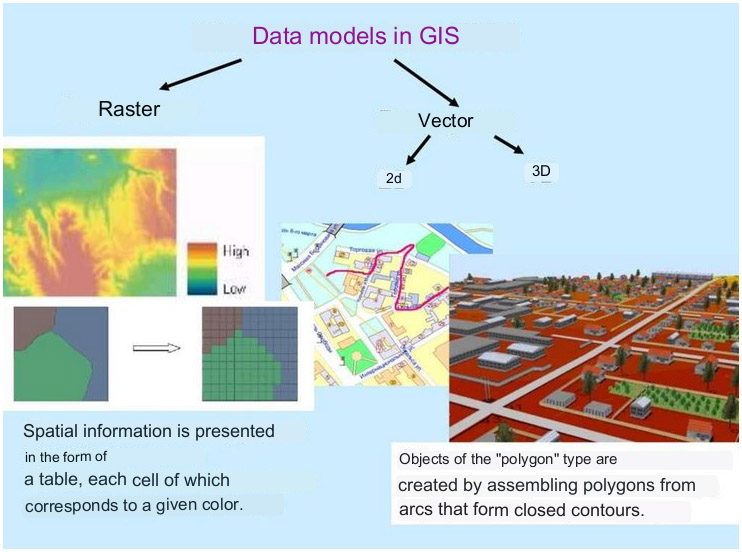
Raster layers are ordinary pictures divided into pieces. When the map is displayed, it is loaded as a given image in various fragments. Raster images have many limitations – you cannot work with them the same way as with a vector – apply styles, work in 3D, etc.
In turn, vector layers are obtained by rendering the numerical data with which these layers are encoded. Vector data is coordinate points, polygons, etc., which are sent to Frontend in GeoJSON format, for example. Frontend receives data, applies its own styles to the coordinate data, and objects are obtained that can be conveniently interacted with – modify them, move them, rotate them in 3D, etc. [1]
GeoJSON is plain JSON, with only markup elements for geographic information.
The second approach for transferring vector data, after GeoJSON, is to use VectorTiles when the data is requested and loaded in parts. If you quickly move the map in Google Maps [5] or Yandex maps [9], then you can notice the map loading in parts.
Filtering data by user request
All systems support data filtering. It is used to cut off uninteresting objects on the map, fragments of the map itself, or to modify different styles. For example, you can display all organizations that are engaged in tire fitting or, on the contrary, hide them, show a satellite map, or display only a schematic version.
When this kind of data changes on the card, blinking may occur at the moment. For open source versions of the SDK, setting up the leveling of such blinking will require additional work with the code – you will first need to leave the previous map layer and, when the data on the map is updated, delete the old layer as well. In commercial products, this behavior is configured automatically and does not require additional modifications.
The amount of data to display on the map
Drawing 10,000 points and their interactive processing and visualization may require a fairly large amount of RAM on the user’s computer – about 100 MB (see Fig. 2).
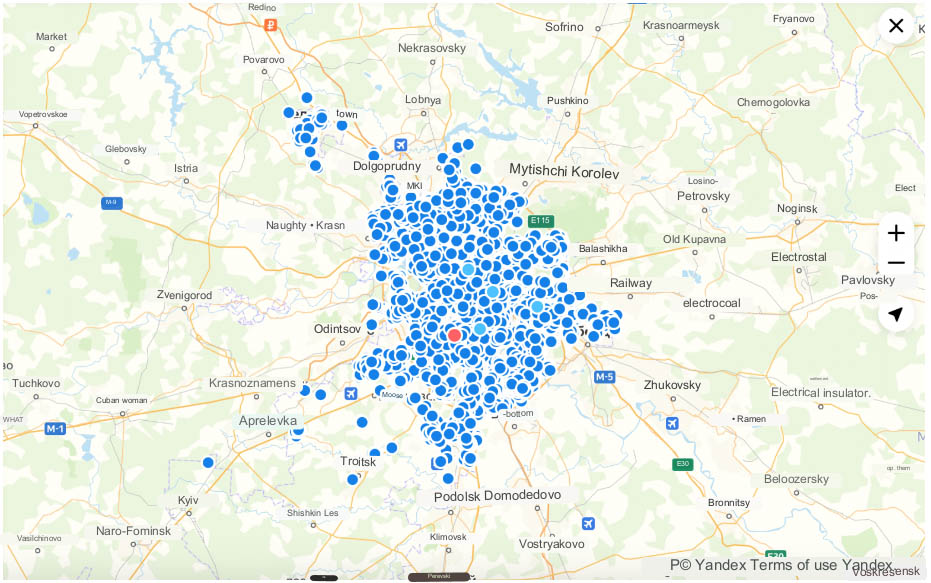
If the number of points is increased to 100,000, then delays may begin to occur and rendering will need to wait in some places in the map. Memory consumption in this case will also increase greatly and can be about 500 MB (see Fig. 3).

On fig. 1.10 shows 100,000 points and these are points for which attributes are not defined and tooltips are not displayed, but in this form it becomes impossible to read the map.
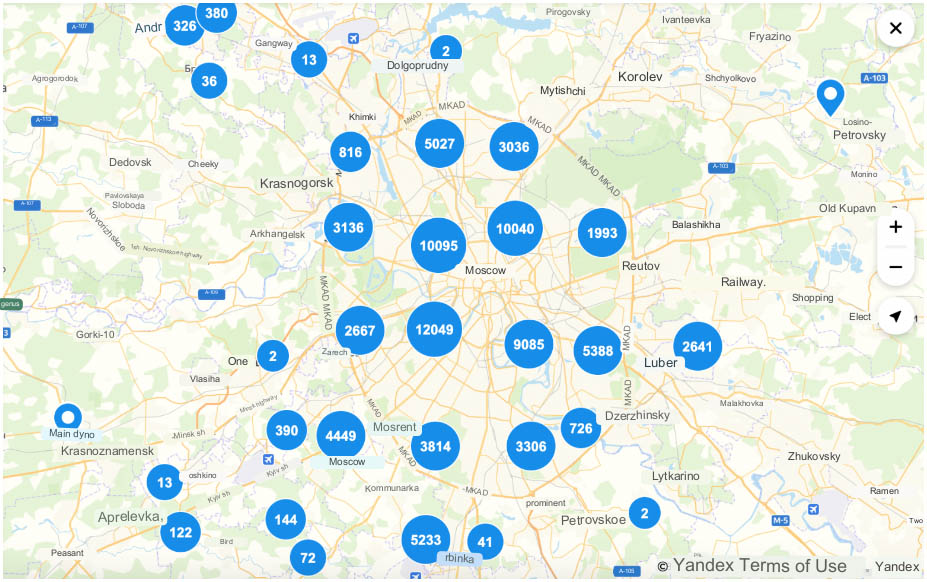
To solve the problem of displaying a large number of points on a map, aggregates are usually used – grouping map objects by certain properties and attributes, for example, by the proximity of objects to each other. This is called clustering (see Figure 1.12). Clustering is often done on the frontend.
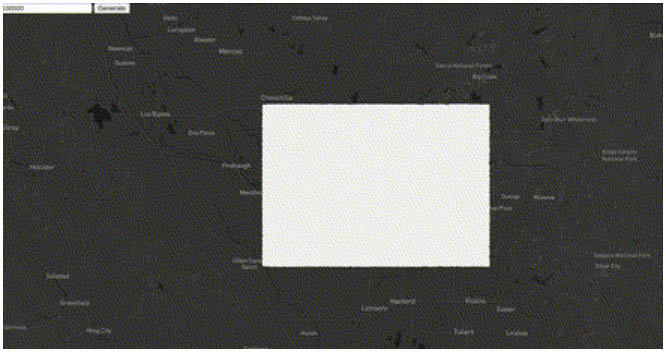
Using the last example of 100,000 points and 500 MB of consumed memory, you can trace the clustering mechanism. If we take all these 100,000 objects on the map and zoom out, i.e. move the map away, you can see that all the points will turn into one large white rectangle. (see fig. 4):
If these 100,000 points are clustered, then all these objects can be collected into different clusters and quite representatively displayed on the map in the form of circles of different diameters, depending on the number of objects referred to by the cluster (see Fig. 5). At the same time, memory consumption is greatly reduced.
If there are a lot of points, then it would be reasonable to do aggregation for the purposes of clustering on the backend side. When the zoom changes, the data is sent to the backend, and the backend returns the result to us in the form of a prepared aggregate.
The backend has the ability to process data quickly, and therefore waiting for a response can take half a second, while this will not be felt on the frontend. In this regard, the load on memory is removed, because. there is no rendering on the frontend side. But for implementation, we need to store and process data in the correct form, so this approach also has its drawback in the form of work on the backend side.
One of the main advantages of the Google Maps API is that all the above described approaches to interactive display of information on a map, including object clustering, can be implemented directly through the API. This greatly simplifies and speeds up the development of the project. [7]
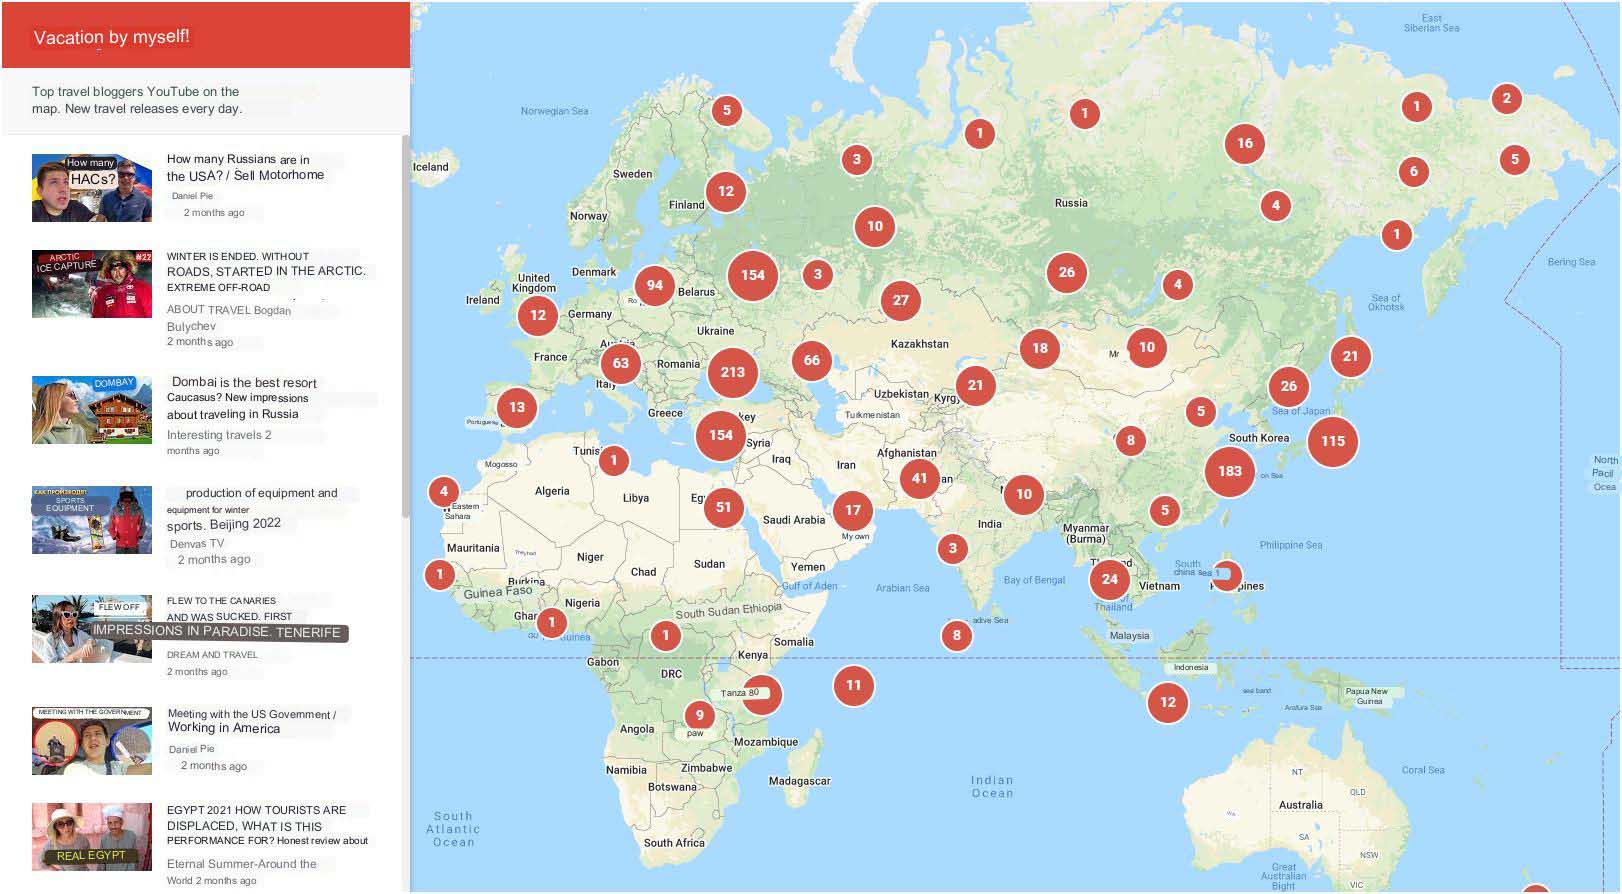
We have implemented Google Maps API in our travel project vOtpuskSam.ru (see Fig. 6), where you can find all the top travel bloggers on one interactive map and check where they are now.

The map is being constantly and automatically updated.
Sources
- Myslyva T.N. Raster data space model. Available at: https://ppt-online.org/534785
- Saenko D. How we drew several thousand interactive objects on the map without harming the performance. Available at: https://habr.com/ru/company/avito/blog/512146/
- Shvetsov N. How we visualized big data on maps: difficulties and features. Available at: https://habr.com/ru/company/lineate/blog/592741/
- Sherova E. Analyzing data using visualization: drawing over Google Maps. Available at: https://habr.com/ru/company/ozontech/blog/574736/
- Google Maps API [Online]. Available at: https://developers.google.com/maps.
- Mapbox API. Available at: https://www.mapbox.com/mapbox-gljs
- Needham M. scikit-learn: TF/IDF and cosine similarity for computer science papers. – 2017. Available at: : https://markhneedham.com/blog/2016/07/27/scitkit-learn-tfidf-and-cosine-similarity-for-computer-sci-ence-papers/
- Preit G. Map of countries’ political maritime borders. Available at: https://github.com/simonepri/geo-maps/blob/master/info/countries-maritime.md
- Yandex Maps API. Available at: https://yandex.ru/dev/maps/